Construction of a weather station.
.
Updated
January 2009
|
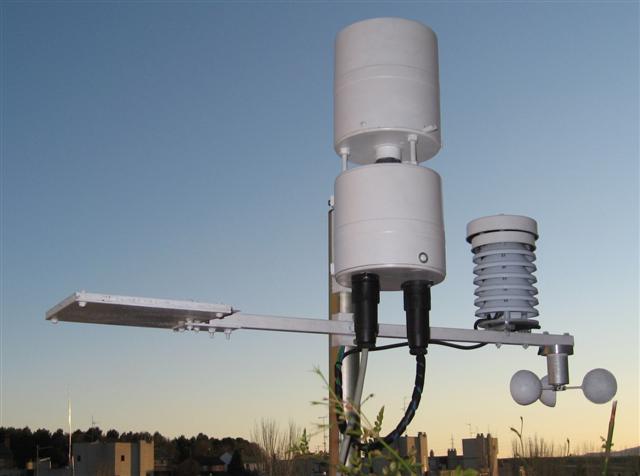
The station with the thermal box and the mechanical anemometer.
. |
Access to the station via the internet: Server in the PC - Server in the COR
This
meteorological station has been specially designed as un accessory to the
astronomical observatory.
Because of this special use, this station uses sensors
that are inexistents in commercial stations, such as the clouds sensor and the rain sensor.
The other provided measures are: environment temperature, relative humidity, dew point,
pluviometry, wind direction and speed. There are four free inputs to add different type sensors.
The main feature of this station is that there
are no mobile parts, excepted the rain gauge. The anemometer and the wind vane are
solid state parts. This kind of sensor is used in extreme environments due to its
great strengh. You can find them in hight mountain zones and in military environment
such as tanks. Here the goal is to facilitate the construction and to achieve
a compact design.
Although you can see a mobile anemometer in the mast, its function was to help me when designing and calibrating the thermal anemometer.
While observing, after a while it often happens that
dew covers the equipment, and as a consequence the session is ruined.
This is avoided by adding heaters to the critical parts of the telescope.
Knowing the dewpoint, you can turn on the heaters just before this phenomenon
appears.
Fig. 1a Example of a night with clouds
and rain. When the rain starts, the clouds indicator falls down because the sensor
is wet. Despite all, the wet surface remains warmer than the bottom dry surface.
There is another frequent situation
when using CCD cameras. You may leave the equipment working on an acquisition
sequence and do something else or go to sleep for a while. In this case, it may be necessary not
only to switch on the heaters. It may get cloudy or even begin to rain. First, the
clouds sensor warns us that there is no sense to continue acquiring images, and that
it will be convenient to chut down before the rain begins. The rain sensor will
confirm the worst and even more, if the clouds are gone, it will indicate us
when the environment goes dry.
The wind speed is another important factor
when deciding to open or close the observatory. It also may get an useful
information in atmospheric turbulence evaluation.
And of course, the scenario where a weather station is going to be essential is when you come to the automation and remote control of your observatory.
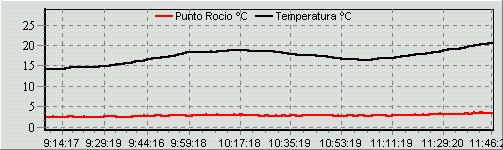
As a rarity, but also in the astronomical
field, it may be interesting to record the effects of a solar eclipse. This
example shows the graph of the annular solar eclipse in 2005:
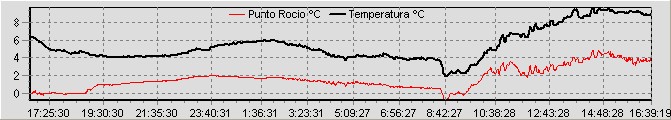
Fig. 1b Temperature during the
annular eclipse of 2005 ( expand)
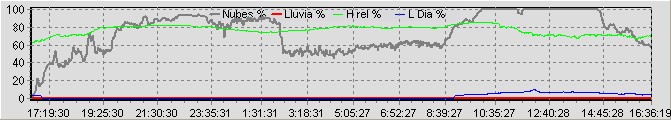
Fig. 1c Relative humidity and clouds sensor
(sun detector during the daylight) during the annular eclipse of 2005 (expand)
As required, this station can be used in the following ways:
- The data are read by a serial port and displayed on the PC.
- The data are integrated in the control program of the observatory.
- Two independent auxiliary outputs allow the station to turn on the dew heaters or close the observatory to protect it from the rain.
- The data is presented in-doors in an LCD display (development pending).
The serial port communication with the station
is based on the following protocol: protocol meteo.pdf
.And once you know the protocol you can write
your own program.
The station body is built from easily available materials and no special
tools are required.
We used PVC parts from plumbing construction.
Two 110 mm unions and three caps are needed.
We want to build two cylinders. One of them open on the top for the rainfall. And the second one containing the electronics, closed.
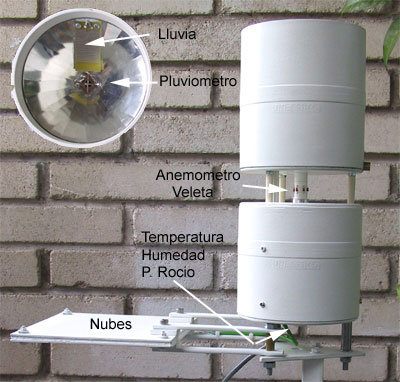
Fig.2 Location of sensors on the station.
Two wires output the station: the clouds sensor
wire and another one for the serial port and the power supply.
The 12v 300mA power supply is used for the serial port ouput and for the control signals.
The electronics
is based on a 8051 compatible microcontroller. Here we used the 89S52
from Atmel, with 8KB flash memory. It is in-board programmable with a single cable
to the parallel port.
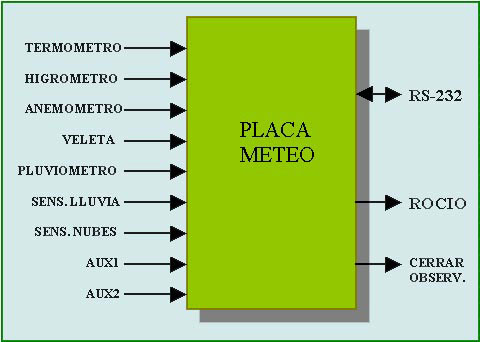
Fig. 3 Block diagram of the station.
The composants are relatively common and
all of them can be found in Farnell. For the station construction kit,
surface mount components were not used.
The AD converter is the eight channels,
eight bits ADC0838. An 8 channels analog switch and an instrumentation amplifier INA126 are used for the anemometer-vane. The remaining signal conditioning is done with an LM324 operational amplifier.

Fig. 4 The printed circuit board.
Rain sensor.
It is designed to detect the first drops of rain.
It is located under the funnel of the rain gauge. The sensor device
is a printed circuit board with two tracks closely intertwined as part
of a high voltage impedance divider. When a drop of water links the two
traces, the voltage in the divisor changes.
Clouds sensor.
It tells us when it gets cloudy. The sensor
is sensitive to low and thick clouds. The ones that produce rain.
These clouds reflect much of the infrared radiation from the earth. So we are
comparing the radiation from the sky and the earth.
Several sensor types were tested. Some commercial
models are based on thermal battery. One sensor points to the ground and the other to the sky.
This involves the use of differential amplifiers and related adjustments.
Undoubtedly the best system, immune to
temperature fluctuations and other disruptions, was developped by Louis J.
Boyd. Wonderful in its simplicity, it is based on the Peltier effect.
Peltier module is a reversible device, it creates a temperature difference when
a voltage is applied to its faces, and a temperature difference between its
faces creates a tension. The Peltier module is differencial for himself and needs
no adjustments, furthermore it is very robust mechanically.
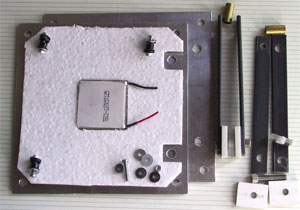
Fig. 5 Parts of the clouds sensor:
two aluminum plates, thermal insulation and the Peltier module.
Two aluminum plates separated by a 15x15cm thermal insulation and sealed at the edges with silicone are used as collectors of the infrared radiation. The mounting screws should have plastic insulation to avoid a thermal bridge.
The rain gauge
It consists of a double tilting cup with a sensor to detect movement. The swinging point of each position is adjusted with two screws situated below the cup. To detect the movement of the cup we can use an optical sensor or a reed relay.

Fig.6 Rain gauge cup.
Our current cup is adjusted to overturn with 4 grams. The water collection surface is 11cm in diameter, so each measure is equivalent to 0.421 liters of rain per square meter.
The funnel rain gauge must be heated in order to measure snow precipitation. Normally the rain gauge is a separate element of the weather station and must have his own heater.
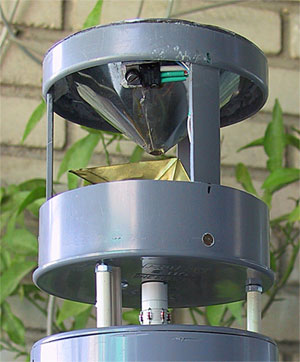
Fig. 7 View of the
rain gauge inside, shows the voltage regulator used as a heater.
In our case, we make use of the heat generated by the voltage regulator of the station. In addition to saving a heatsink, the main heat source is situated far from the temperature sensor located bellow.
Anemometer and weathervane
The station has a connector for a
mechanical anemometer but the wind speed can also be obtained from sensors
that have no moving parts. The classic method is called hot-filament method.
The heat flux from the hot wire to the environment depends on the speed
of the surrounding air and follows a quadratic law. The dissipated power is
proportional to the square root of the wind speed. Measuring how much
energy we must provide to maintain the temperature, we can compute the wind speed.
With this type of sensors it is possible to obtain high precision and very
high response times, up to 2KHz, depending on the construction.
The weathervane is obtained by placing
several anemometers on the perimeter of a vertical cylinder. To determine
the wind direction it's enough to know which sensor detects the higher wind speed.
In hight-grade devices the sensor is made of platinum. A cheap alternative
is to use transistors or zener diodes.

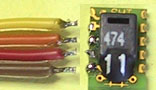
Fig. 8 Thermal anemometer-vane
sensor with six zener diodes plus a reference one.
After having experienced some solid state
anemometers based on transistors (Woodward, Stephen. Self-heated
transistor digitizer Airflow. EDN Magazine. Design Ideas, March 1996),
the design I prefer for its simplicity and easy construction is the one based
on Zener diodes. An idea developed by Miguel de la Fuente and Juan Manuel Cano
in the Universidad de Jaen.
They apply a constant tension to the diode, keeping it
in the zener area with a current of about 30mA. When the wind blows, the Zener tends
to cool. As the tension is maintained constant by an external source, the current grows
to restore the working temperature.
This anemometer-vane consists of six zener
diodes equidistantly mounted on a vertical cylinder. Another zener diode is located
inside the cylinder for reference. The zener reference diode compensates the
ambient temperature effect.
If you just want to build the anemometer,
place a single zener (in addition to the reference) in the pin 8 of J8.
In any case the station will always give six readings. It's the PC program that
decides which readings to use.
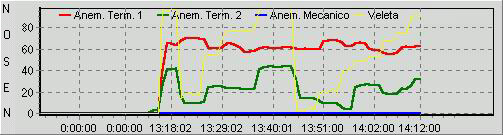
Fig. 9 These graphs were generated
by turning the station in front of a fan. First by 90 degrees steps and then by 45
degrees steps.
The yellow courve represents the wind direction.
The red courve is proportional to the speed.
The construction of this sensor is not very easy.
The zener diodes are low precision parts, so it's necessary to choose six
diodes having the zener voltage as close as possible.
The reference zener should be the one with the lowest zener voltage.

Fig.11 Curve obtained from the
calibration of the anemometer.
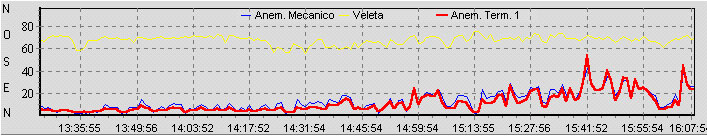
Fig.11b Real data.
Temperature, humidity and
dew point.
The SHT11 Sensirion chip is used for temperature and humidity reading. This sensor includes all the signal processing and
a 14 bits AD converter.
There are special sensors for dew point
measuring. But in our application we compute it with
good precision from temperature and humidity.
 -
-  -
-  -
-  -
-  -
- 
The sensor is fixed inside a platic
tube with a piece of mouse rug. A piece of fine mesh allows air to pass through the probe.
The sensor being very small, here are somes tips to follow:
1 - Use flat cables. The distance between
wires is the same as the distance between contacts.
2 - The soldering tip should be clean and sharp like a pencil. Do not use welders with more
power than 40W. A light with a good magnifying glass will help.
3 - Protect the sensor inside a plastic tube and
close the tube with a fine mesh that allows only air to enter.
This sensor is placed at the bottom of the station to protect it from direct sun and rain.
Barometer.
A pressure sensor MPXA6115A6U is used for the construction of the barometer. It's located on a little auxiliary board. Click here to download the board-plane and the circuit.
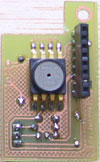
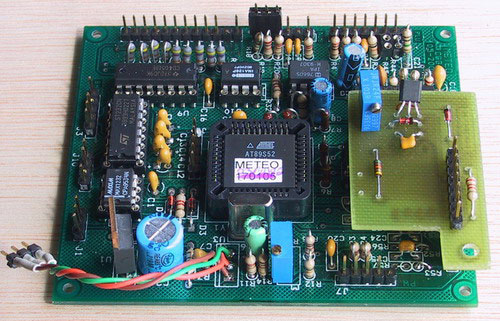
Fig.12 The barometer board with the sensor in the bottom side, and its location on the main board.
This relay board has two relays allowing
the use of the control outputs of the station. It also hosts the diode bridge and condensator
of the power supply. Just a 12 V 300 mA tranformator must be added.
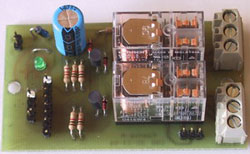
Fig.13 Power supply board with control relays.
For more easy construction, the board is simple side. Click to download the circuit and PCB footprint.
EMA v2, New version. (January
2009)
This new version is based on the previous model but
includes all the experience of the last four years. New features are added and the
assembly is simplified. The microcontroller has a greater capacity: 64K flash memory,
2K RAM, and 8 10 bit AD channel.
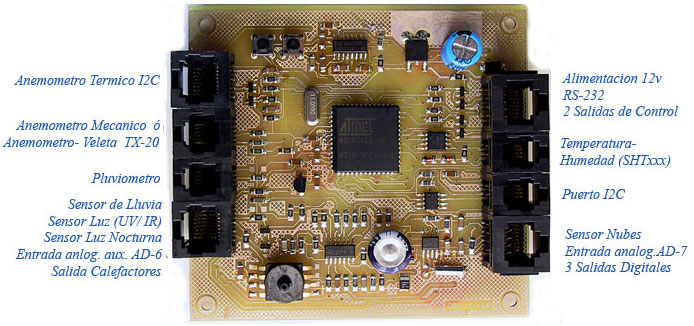
Fig.14 Final prototype of the station EMA v2.
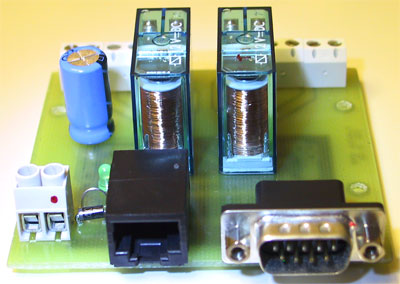
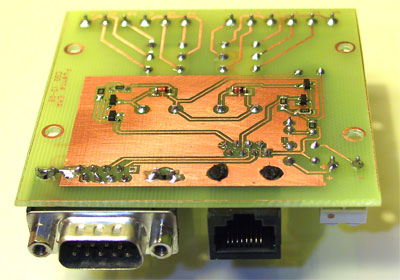
Fig.15 New power supply board with the control relays.
--- Included news:
- 500 KB Data loger to store:
o
Readings every 5 minutes over 24 hours.
o
Maximums y minimums every hour for the last 24 hours.
o
Daily maximum and minimum over a year.
- Real time clock for dating the stored readings
.
- Program update by serial port.
- Input for a night-sky brightness sensor.
- Input compatible with the anemometer
wind vane TX20 from
- Communication protocol compatible with
commercial software as Wheather Display or Virtual Weather Station.
- On board barometer.
- Additional on board
temperature sensor.
- I2C port for
multiple external sensors.
- RJ connectors
for easy wiring.
- Thermal anemometer by
I2C.
--- Changes made:
The circuit for implementing the zener-diodes anemometer
has not been included in the printed board. Nevertheless, the necessary input/output signals
are still available. The circuit could then be placed out of the board.
A new thermal anemometer is implemented.
Based on digital thermal sensors it is much easier to calibrate.
-----------------------------
For more information or assistance
in the construction join the group:

Click to join ObservatorioRemoto
![]()